Unit Economics for Hardware Founders: What Software Metrics Don't Prepare You For
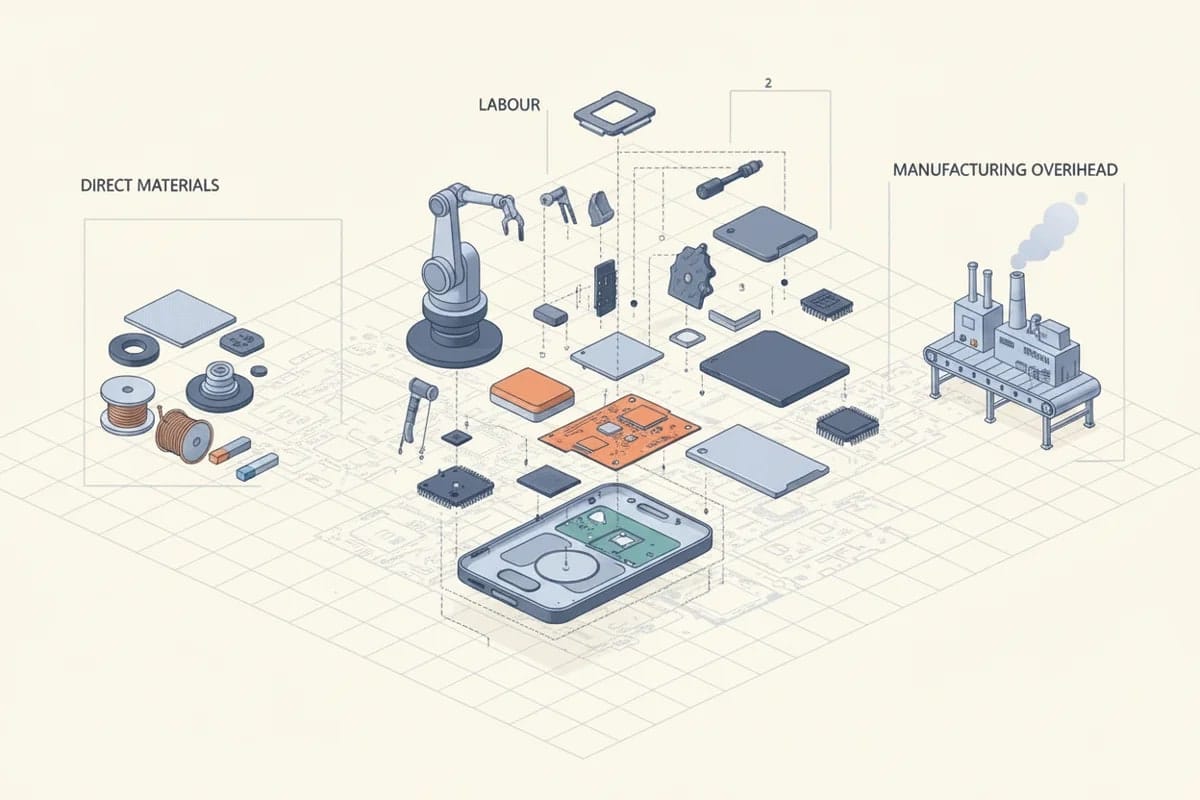
Hardware founders face unique unit economics challenges that differ from software metrics, including direct materials, labour, and manufacturing overhead

Founders who have built software businesses carry a set of intuitions about unit economics that serve them well until the moment they start manufacturing something physical. In software, the marginal cost of serving an additional user trends toward zero, and the dominant variables are customer acquisition cost and lifetime value. In hardware, every additional unit you produce consumes real materials, real labour time, and a share of overhead that behaves in ways that can surprise even experienced operators. Understanding the structure of manufacturing unit economics is not merely an accounting exercise; it is the foundation on which pricing decisions, fundraising narratives, and production scaling strategies must be built.
Defining Cost of Goods Sold in a Manufacturing Context
Cost of goods sold in a manufactured product company refers to the total direct cost of producing each unit that leaves the factory. It has three components that are worth understanding individually before considering how they interact.
Direct materials are the raw materials and components that are physically incorporated into the finished product. For an electronic assembly such as a drone flight controller, direct materials would include the printed circuit board, microcontrollers, capacitors, resistors, connectors, and the enclosure. These costs are generally the most visible to founders because they appear on supplier invoices and are easy to trace to a specific product. What founders frequently underestimate is the cost of materials that are consumed but do not end up in a finished unit, which is the yield problem discussed later.
Direct labour refers to the wages and associated employment costs of workers who are directly involved in the production process. In an electronics assembly context this includes the technicians operating pick-and-place machines, the operators running reflow ovens, and the inspectors performing in-circuit testing. It does not include the salaries of the production manager, the quality director, or the factory accountant, because those roles are not directly traceable to a single unit of output.
Manufacturing overhead is the category that most software-trained founders underestimate most severely. It encompasses all the indirect costs required to run the production facility, including utilities such as electricity and compressed air, depreciation on production equipment, maintenance contracts, factory rent, and the salaries of indirect production staff. These costs are real and they must be absorbed into the unit cost of every product manufactured, even though they cannot be traced to a single unit in the same direct way that materials and labour can. A common method is to allocate overhead as a percentage of direct labour cost or as a rate per machine hour, and the choice of allocation method can meaningfully change the apparent unit cost of a product.
Contribution Margin and Gross Margin Are Not the Same Thing
Software founders are accustomed to thinking about gross margin as the primary measure of unit-level profitability, and in a software business where almost all costs are fixed, gross margin and contribution margin are often close to identical. In manufacturing they diverge in ways that matter for decision-making.
Gross margin is calculated as revenue minus cost of goods sold, where COGS includes both variable and fixed manufacturing costs. If your factory has a fixed overhead base of £200,000 per month and you produce 1,000 units, each unit carries £200 of overhead. If you produce 2,000 units, each unit carries £100 of overhead. The gross margin of the business therefore changes with production volume even if the selling price and variable costs per unit remain constant.
Contribution margin is calculated as revenue minus variable costs only, where variable costs are those that change directly with each additional unit produced, primarily direct materials and the variable portion of direct labour. Contribution margin tells you how much each additional unit sold contributes toward covering fixed costs and eventually generating profit. It is the metric that should govern short-term pricing decisions, capacity utilisation choices, and the question of whether to accept a large order at a discounted price. A unit that sells below gross margin but above contribution margin is still making a positive contribution to the business, provided the fixed cost base is already covered.
The practical implication for hardware founders is that you need to know both numbers and understand which one is relevant to the decision in front of you. Using gross margin to evaluate a marginal order will lead you to refuse business that would have improved your financial position, and using contribution margin to evaluate your long-term pricing strategy will lead you to underprice products and fail to recover your fixed cost base.
Yield Loss and Rework Are Larger Costs Than Almost Every Founder Expects
In electronics manufacturing, minor deviations in process parameters such as solder paste volume, reflow temperature profiles, or component placement accuracy can lead to yield erosion of between two and five percent of units produced. That figure sounds small until you trace its effect through the economics of a production run.
Yield loss means that you consume materials for units that do not become sellable products. If your direct material cost per unit is £80 and your yield is 95 percent, you are effectively spending £84.21 in materials for every good unit you ship, because you must account for the five units in every hundred that consume materials without generating revenue. This effect is invisible in a standard bill of materials calculation and is one of the most consistent sources of cost underestimation in early production runs.
Rework is the process of correcting defective units so that they can be brought up to specification rather than scrapped entirely. The intuitive assumption is that rework costs are primarily the labour cost of fixing the defect, but research into manufacturing quality losses indicates that direct labour accounts for only 30 to 40 percent of the true cost of rework. The remaining cost is composed of machine time that could have been used for productive output, downstream disruption to the production schedule, management time spent investigating and resolving the root cause, and the risk of introducing secondary defects during the rework process itself. An average quality loss rate of three percent has been shown to reduce Overall Equipment Effectiveness by five to seven percentage points and increase total production costs by eight to twelve percent, which is a substantially larger impact than most founders model when building their financial projections.
The decision between reworking a defective unit and scrapping it is not always straightforward. Rework is economically preferable when the cost of rework is less than the material value of the unit and the rework process has a high success rate. When rework processes are poorly defined or when the defect rate is high enough to create a rework bottleneck, scrapping and improving the process upstream is often the more rational choice, even though it feels more wasteful in the short term.
How Production Volume Changes Unit Cost
The relationship between production volume and unit cost is governed by two related but distinct mechanisms. The first is the spreading of fixed costs over a larger number of units, which is straightforward arithmetic. The second is the learning curve effect, which describes the empirical observation that as cumulative production volume doubles, the direct labour hours required per unit tend to fall by a consistent percentage, typically between ten and thirty percent depending on the complexity of the assembly process. This happens because operators become more proficient, process improvements are identified and implemented, and tooling and fixtures are refined over time.
The important qualifier is that these benefits are not unlimited. Beyond the optimal capacity of a given production line or facility, additional volume can introduce inefficiencies including overtime costs, increased defect rates from operator fatigue, and supply chain strain from ordering materials at volumes that exceed standard supplier lead times. Founders who build financial models assuming that unit costs will continue to fall linearly with volume are likely to be disappointed when they encounter the practical limits of their production system.
A Worked Example Using a Drone Electronic Assembly
Consider a company manufacturing an electronic speed controller for commercial drones. At a production volume of 500 units per month, the unit economics might look like the following.
Direct materials, including the PCB, MOSFETs, microcontroller, passive components, and enclosure, cost £55 per unit based on the bill of materials. Direct labour, covering SMT assembly, reflow, inspection, and final test, costs £18 per unit at the current production rate. Manufacturing overhead, including equipment depreciation, facility costs, and indirect labour allocated at a rate of 80 percent of direct labour, adds £14.40 per unit. This gives a total COGS of £87.40 per unit at 500 units per month.
Now apply a realistic yield assumption. If the first-pass yield is 94 percent, the effective material cost per good unit rises to £55 divided by 0.94, which is £58.51. If rework recovers half of the failed units at an additional cost of £12 per reworked unit, the blended material and rework cost per shipped unit rises further. The adjusted COGS, accounting for yield and rework, moves from £87.40 to approximately £93 to £95 per unit depending on the precise rework recovery rate. A founder who built their pricing model on the bill of materials cost alone and ignored yield and rework would be underestimating COGS by roughly seven to nine percent before accounting for any other surprises.
If the selling price is £140 per unit, the gross margin at the bill of materials COGS is 37.6 percent. After adjusting for realistic yield and rework, the gross margin falls to approximately 32 to 34 percent. If the variable costs are £73 per unit (materials plus variable labour), the contribution margin is £67 per unit or 47.9 percent of revenue, which is the figure that should govern decisions about discounted volume orders.
At 1,500 units per month, assuming a 15 percent reduction in direct labour cost from learning curve improvements and the same overhead base spread across three times as many units, the overhead allocation per unit falls from £14.40 to approximately £5.60, and the direct labour cost falls from £18 to approximately £15.30. Total COGS before yield adjustment drops to around £75.90, and gross margin at the same £140 selling price improves to approximately 45.8 percent. This illustrates concretely why investors in hardware businesses are so focused on the path to volume, because the margin profile of the business at scale looks fundamentally different from the margin profile at prototype or early production volumes.
What This Means for Founders and Investors
The founders who navigate the transition from software to hardware most successfully are those who build their financial models around realistic yield assumptions from the beginning, treat rework as a cost centre that deserves the same analytical attention as direct materials, and understand that the gross margin they will present to investors at Series A will be substantially different from the gross margin they will achieve at the volumes that make the business viable. Investors who understand manufacturing will ask about first-pass yield rates, overhead absorption rates, and the production volume at which the business reaches its target gross margin. Founders who can answer those questions with specific numbers rather than general optimism will be taken considerably more seriously than those who cannot.